
template <- threeBrain::merge_brain(
template_subject = "cvs_avg35_inMNI152",
template_surface_types = c("pial", "inflated")
)
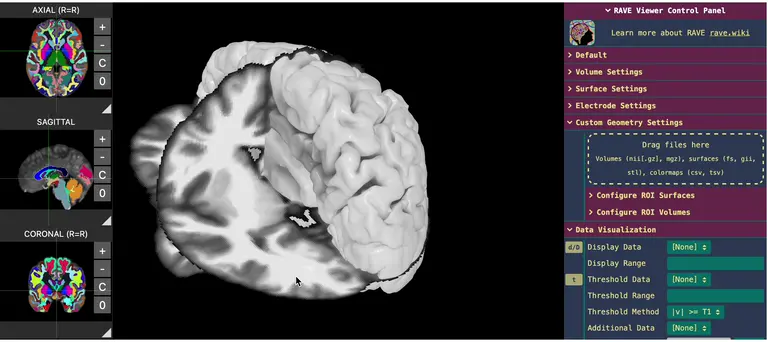
template$plot(
side_display = FALSE,
controllers = list(
"Left Opacity" = 0.1,
"Right Opacity" = 0.1
)
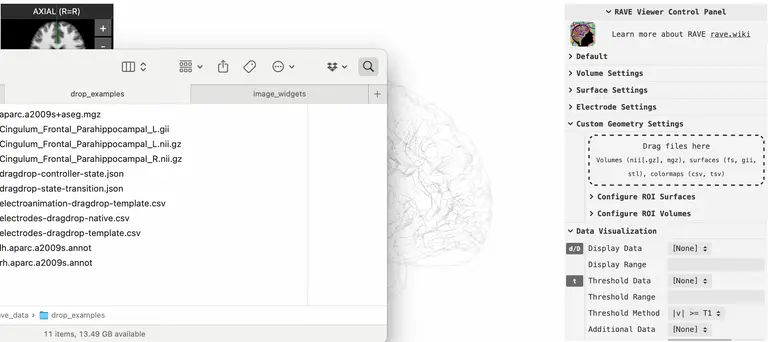
)How to use this demo
The 3D viewer supports dragging & dropping files for quick adhoc visualizations. Click on the links below to see different use-cases. If you would like to open the viewer locally and try it out, please download an offline version once the viewer is ready.

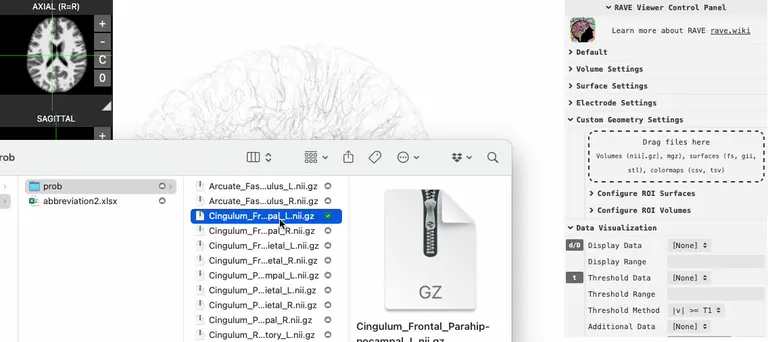
- Drop GIfTI (
*.gii), STL (*.stl), or FreeSurfer mesh files (*h.pial,*h.white,*h.smoothwm,*h.inflated, …) - To clear the object, open
Configure ROI Surfaces>Clear Uploaded Surfaces
- Drop GIfTI (
Example files: left hemisphere and right hemisphere
- Drop FreeSurfer annotation (
*.annot) or curvature files (*.curvor*.sulc) - To clear the object, open
Configure ROI Surfaces>Clear Uploaded Surfaces
- Drop FreeSurfer annotation (
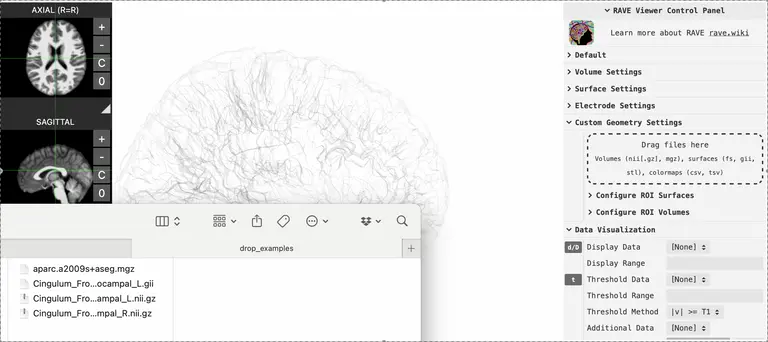
- Drop in a NIfTI (
*.nii,*.nii.gz) or a MGZ (*.mgz) file - Clamp volume via threshold using
Clipping Min/Max - Set color map to “continuous” or “single color”
- Drop in a NIfTI (
- Drop in a NIfTI (
*.nii,*.nii.gz) or a MGZ (*.mgz) file - Set color map to “discrete”
- Subset and enter the atlas labels in
Volume Settings>Voxel Label - Generate quick surface from the labels by clicking
Update ISO Surface
- Drop in a NIfTI (
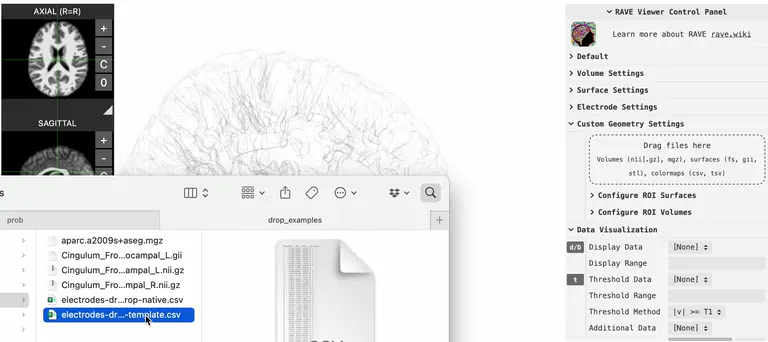
- Prepare an electrode coordinate file (see an example from the link above). The bare minimum columns are
Electrode(channel number),Label(contact label), and anatomical coordinates (see below)- For visualizing on template brain, please specify either column set
MNI152_x,MNI152_y,MNI152_z(known as the MNI coordinate) orMNI305_x,MNI305_y,MNI305_z(known as fsaverage coordinate) - For visualizing on native brain, specify
T1R,T1A,T1S(scanner RAS coordinate) orCoord_x,Coord_y,Coord_z(surface, or FreeSurfer tk-registered coordinate)
- For visualizing on template brain, please specify either column set
- Prepare an electrode coordinate file (see an example from the link above). The bare minimum columns are
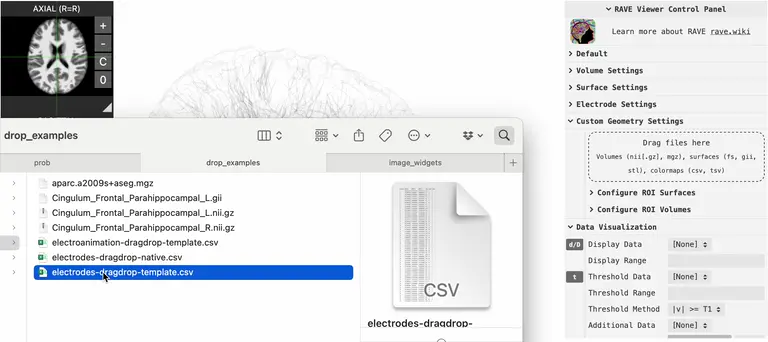
Example coordinate file & value table
- First, drop in an electrode coordinate file (see the example coordinate file above)
- Then, drop in an electrode value table with
Electrode,Time, and one or more variable columns (see the example value table above) - Finally, turn on
Data Visualization>Play/Pauseto start animation - (Optional) to hide inactive electrodes, go to
Electrode Settings>Visibility, and set to “hide inactives”
- Go to
Default>Copy Controller State, the viewer state will be copied to the clipboard (download the example data to see what is inside) - You can directly copy the state string to the text box (
Default>Paste to set State) or save the string to ajsonfile and drag & drop in
- Go to
Download this example file and try out! The file is essentially a
jsonfile with one flag, some global parameters and settings for each transition.- The flag is
"isThreeBrainTransition": true, allowing RAVE to know how to handle the file - Global parameters include
resetCanvas: whether to reset canvas to its default state before applying transition animationloops: number of additional loopstrasitionDuration: duration of a transition, can be set at stage-leveltransitionTimeout: total timeout for each transition before switching to the next state, can be set at stage-level
- The transition data is an array of states:
background: the canvas backgroundcameraMain: contains cameraposition,updirection, andzoomlevel- Each
controllerslist sets the controller values at beginning of the transition (immediate), interpolated animation (animated), and at the end of the transition (delayed)
- The flag is